ctReports
In the Reports module you will find two menus 
Reports and Dashboard
If you choose a report, you will enter the module that shows a selection of possible pre-defined reports. Look below.
These are the following choices: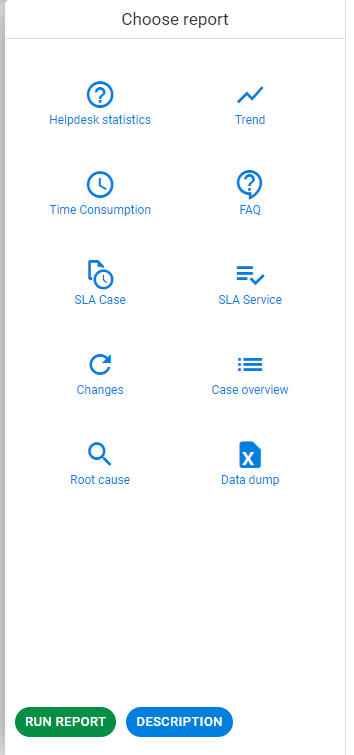
Each report is described ![]() on the right side of the menu if you click the icon and
on the right side of the menu if you click the icon and
select 
In the lower left you can access more filter options.
Helpdesk statistics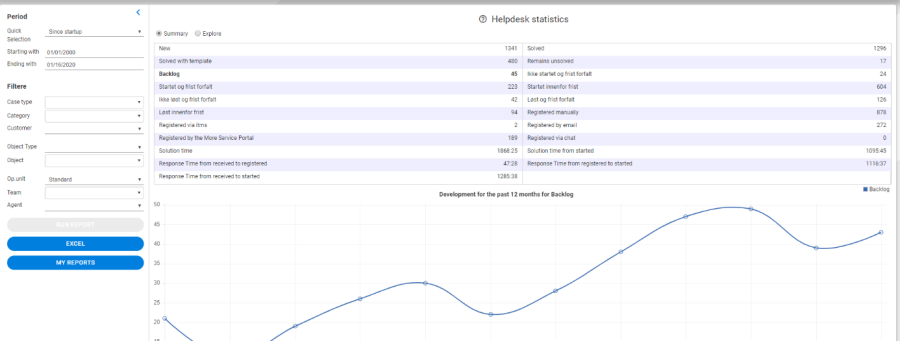
This report shows the most important performance indicators for the help desk for a selected period.
Here you can, for example, get answers to
- Where the cases come in
- SLA achievement
- Template usage
- Average resolution time per priority.
The indicators are defined as follows:
- New: Cases recorded in the period that match the filter. With the filter on the operating organization unit, the time when the case was resolved (for the last time) is used. If the case was open at the end of the chosen period, the operating organization unit the case was used at this time. Similar logic is also used for agents and team filters.
- Resolved: Service with settlement date during the period (at the end of the period had status "Resolved" or "Remain unresolved". With filter on operating organization unit / team / agent, the state of the case is checked at the time the case was resolved (for last time) against selected values.
- Resolved with template: The proportion of solved where the template is used.
- Remaining unresolved: The proportion of "solved" who has the status "remains unresolved".
- Backlog: Number of Service not completed at the end of the period.
- Not started and deadline due: Number of cases with start-up deadline, which was not started within the defined deadline at the end of the period.
- Started and deadline due: The number of cases started during the period when the start date was after the defined start date and at the start of the day had chosen operator / agent / team.
- Started within deadline: Number of cases started during the period when the start date was before the defined start date and at the start of the day had chosen operator / agent / team.
- Unresolved and deadline due: Number of cases with deadline which were not resolved by the deadline within the defined deadline.
- Solved and deadline due: Number of cases resolved during the period when the date of settlement was after the defined deadline and at the time of the solution had chosen the operator / agent / team.
- Solved within deadline: Number of cases resolved during the period when the date of settlement was before the defined deadline and at the time of the solution had chosen the operator / agent / team.
- Registered More Service: Number of "new" that was registered manually in More Service.
- Registered IMore Service: Number of "new" that was registered manually in iMore Service.
- Registered email: Number of "new" received via email.
- Registered portal: Number of "new" received from the user portal.
- Registered chat: Number of "new" received from chat.
- Resolution time: Average time from registration to last time the case got status solved. Calculated according to "solved". Time outside working hours (8-16) and weekends are counted as 0.
- Solving time from start: Average time from start to last time the case got status solved. Calculated according to "solved". Time outside working hours (8-16) and weekends are counted as 0.
- Received to registered: The average time spent from the cases ("new") was received until they were registered. Calculated based on the cases that were not registered manually. Time outside working hours (8-16) and weekends are counted as 0. Use the "Database" tab to find any deviations.
- Registered to start: Average time spent from cases ("new") was registered until they got "started" status. Items that are not started are not included in the calculation. Time outside working hours (8-16) and weekends are counted as 0.
- Received to Started: Average time spent from cases was received until they got started. Calculated based on the cases that were not registered manually. Time outside working hours (8-16) and weekends are counted as 0.
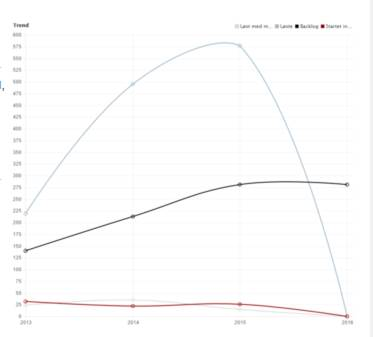
Trend report
The trend report shows how selected values have evolved over time.
"Are we solving as many cases as new ones comes in?" is a common question that this report is ideal for, but it also has many other uses. For example
- Do we spend less time solving cases now than before?
- Do we spend less time registering cases now than before?
- Monthly report / Annual report to customers to show the number of achieved and broken SLA.
- Are our templates updated?
Time Consumption Report:
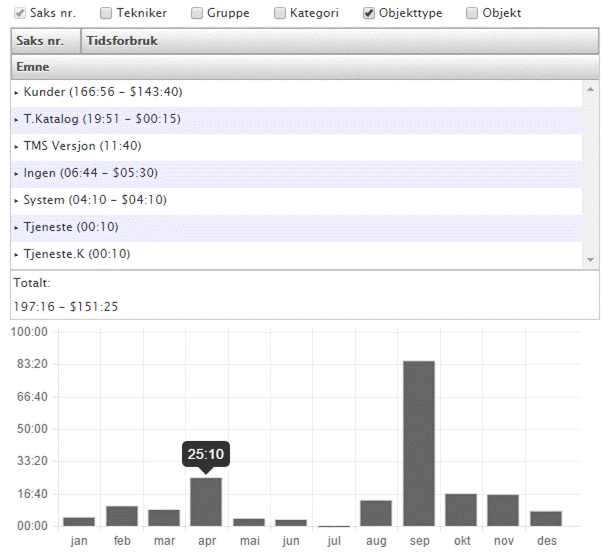
Shows how much time is spent in the help desk, with the ability to group on agent, department, object, object type and category. For example, it can provide answers to questions like
- How much time is spent for cases in department X with the "support" category?
- How much time did agent X spend on system Y in department Z?
Time consumption is calculated based on time recorded on all types of logs, ie
Time spent on the case = Work logs + Emails + Task logs
Calculations can also be restricted to a specific department, object, etc., or combinations of these. The following behavior applies to the filters
- Category / case type / department: Work logs, emails and task logs associated with cases with selected values.
- Object Type / Object: Work Logs and emails associated with cases that have at least one object with selected values and task logs associated with tasks with objects similar to selected values.
- Agent: Work logs, emails and task logs registered by chosen agent.
- Operational organization unit: Work logs, emails and task logs where agents at the time of registration (to the log) belonged to the selected operating organization unit.
- Team: Work logs and emails where the case at the time of registration (to the log) belonged to the selected team.
FAQ report
Shows a chronological overview of the FAQ searches made on the user web and how many results were found.
As well as an overview of which FAQ keywords are used on the user web. Number of results for a search query may vary based on FAQ's revision and whether it was published at the time of the search, therefore, the average number of results for each word appears.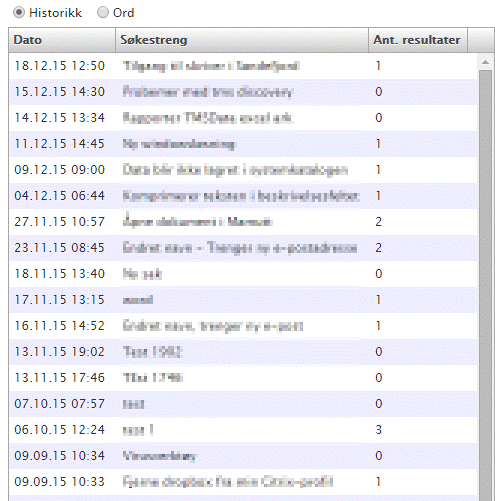
Access report
An overview of Access that match the filter as of today.
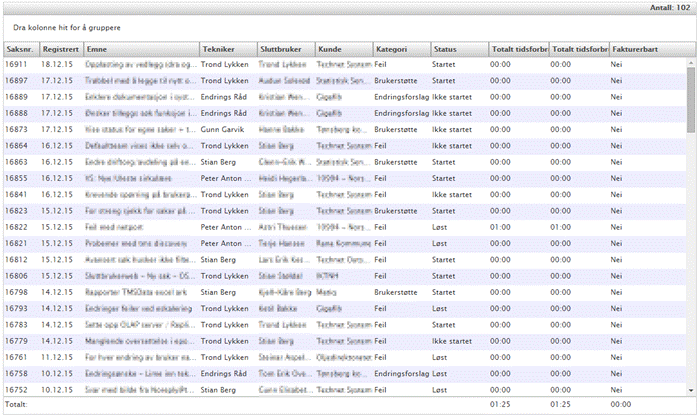
Cases report
An overview of cases that match the filter to date.
This shows the total time spent on cases that match the filter.
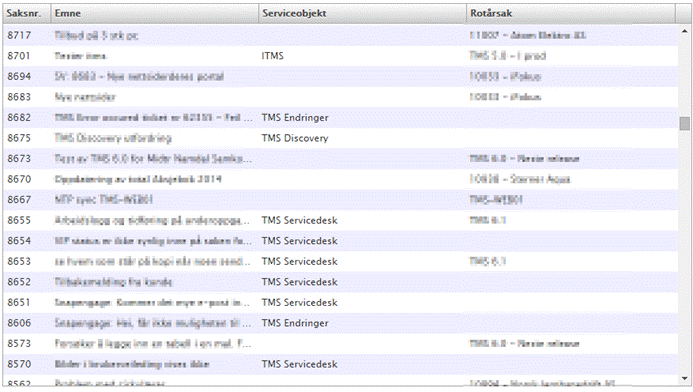
Root cause
Makes a list of all cases in the selected period, with registered item from service catalog and the root cause.
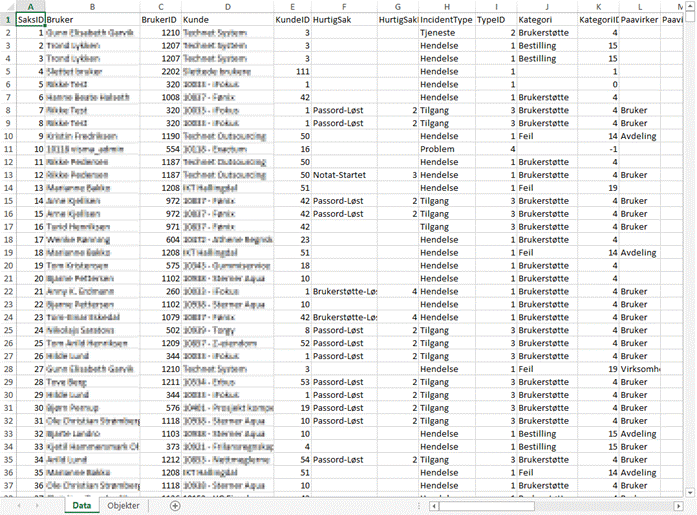
Data dump report
Raw data in Excel format
Dashboard
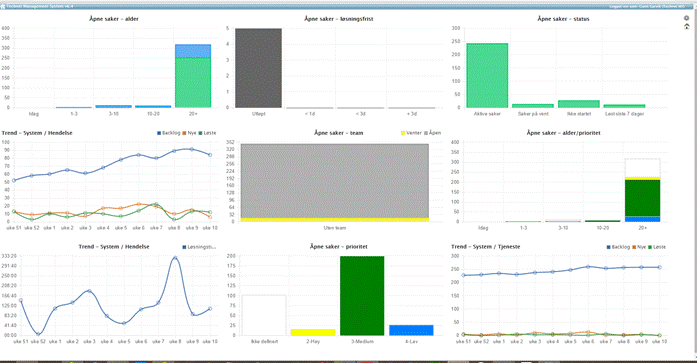
Under the Servicedesk sub-menu «Reports» you can also set up a Dashboard, which can be displayed on a big screen. Dashboard can show contemporaneous information for individual reports and updates every minute.
..
To set up a dashboard, select the «Dashboard» feature on the menu, and the following view will appear. This is an example setup of a dashboard.
You can set up your own dashboard by selecting the icon ![]() in the top right corner.
in the top right corner.
By clicking the icon you get the following menu: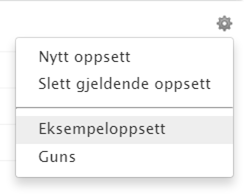
Select "New Setup" for self-selected reports that will appear in the dashboard.
The example setup will always be available.
You get the following view:
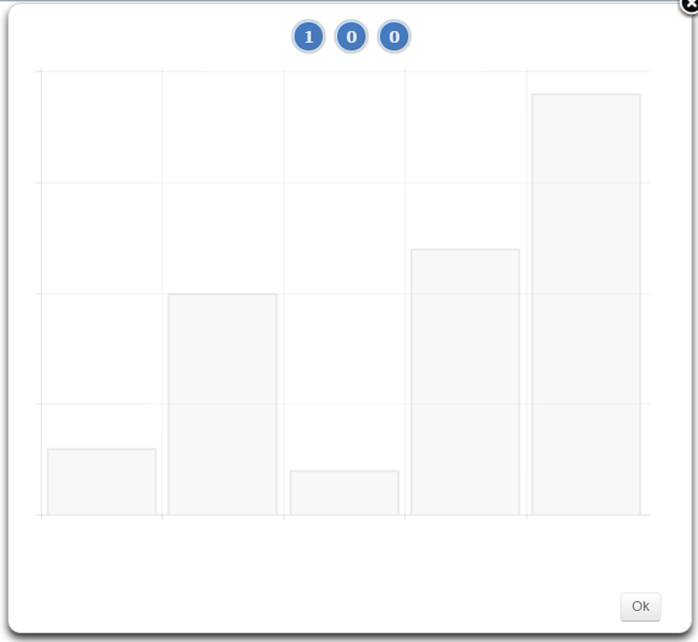
To select the number of reports shown per row, press the numbers. Maximum number is 3 reports per. row and 3 columns
Once you have chosen the number of reports you want to display in your dashboard, select "OK" at the bottom right.
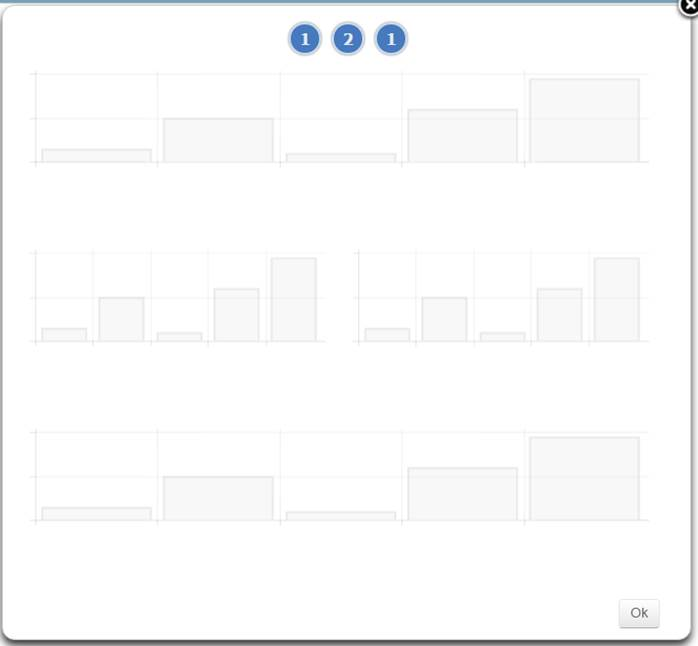
The report will then appear as shadows throughout your screen with the number of reports to be selected per row. Click directly on the first row that shows an indicator for the report.
Here you can choose a report type / graph from list below.
For example, select «The status of the week». The selected report is highlighted. Click the icon «Next».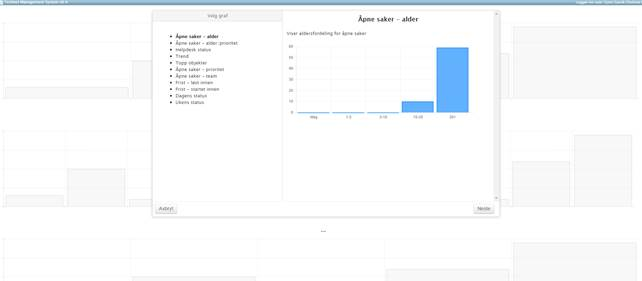
The report is displayed. Click on the next report you want to insert, for example select "Trend"
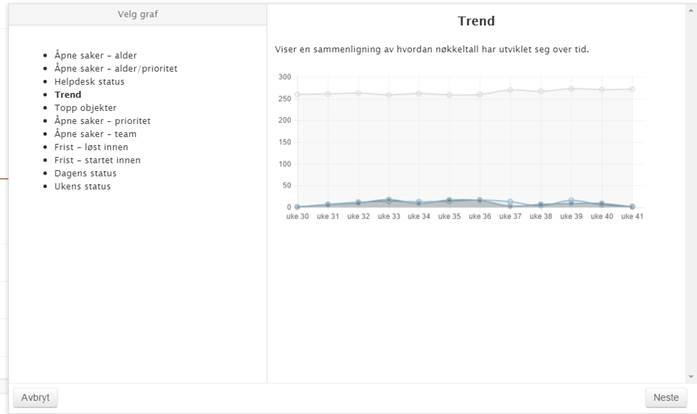
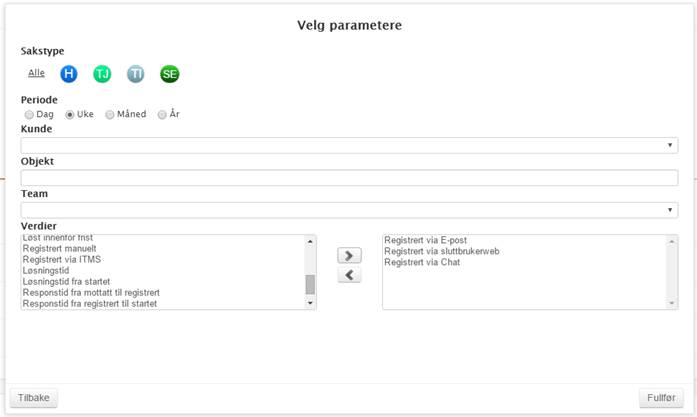
Click "Next". The following parameter selection appears, as shown in the view below.
Default choices are «All» types of cases, but you can also choose only I-Incident, -S-Service, etc.
Period: Day, week, month, or year.
Customer: Opportunities to follow up a specific customer group.
Item: Opportunities to follow up for example an application for a certain customer group, or all if you choose no one,
Team: Opportunities to choose a team or all
Values can be selected by marking the desired values in the left field,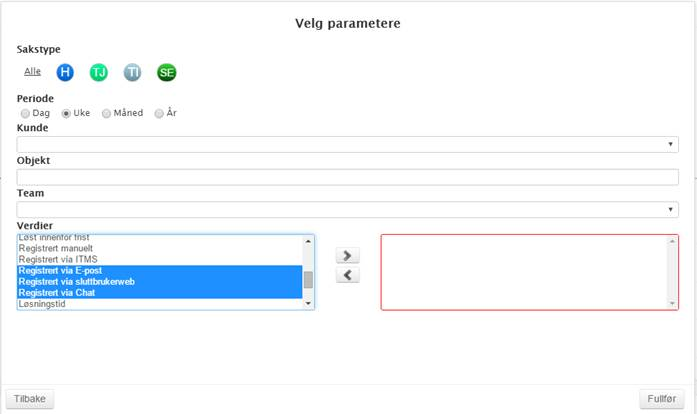
Use the arrow key > so that they are moved to the right field, as shown below. Then click "complete" at the bottom right of the view.
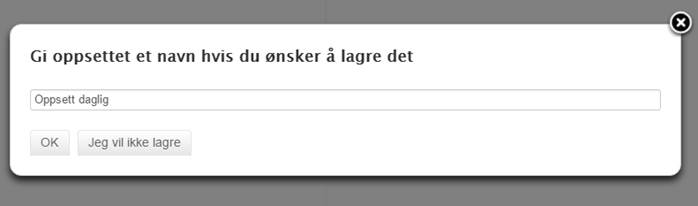
Continue to select dashboard reports, and set the up, until the dashboard is filled as you planned. When done, the following dialog box appears.
Give the dashboard a name and choose "Save"
Edit Dashboard
Dashboard can be edited by selecting the saved dashboard you want to edit.