...
Under the Servicedesk sub-menu «Reports» you can also set up a Dashboard, which can be displayed on a big screen. Dashboard can show contemporaneous information for individual reports and updates every minute.
..
To set up a dashboard, select the «Dashboard» feature on the menu, and the following view will appear. This is an example setup of a dashboard.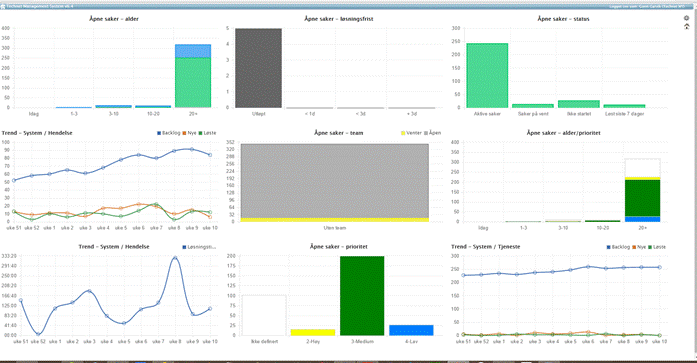
You can set up your own dashboard by selecting the icon ![]() in the top right corner.
in the top right corner.
By clicking the icon you get the following menu: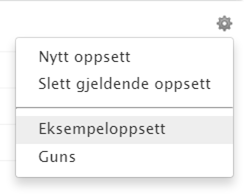
Select "New Setup" for self-selected reports that will appear in the dashboard.
The example setup will always be available.
You get the following view:
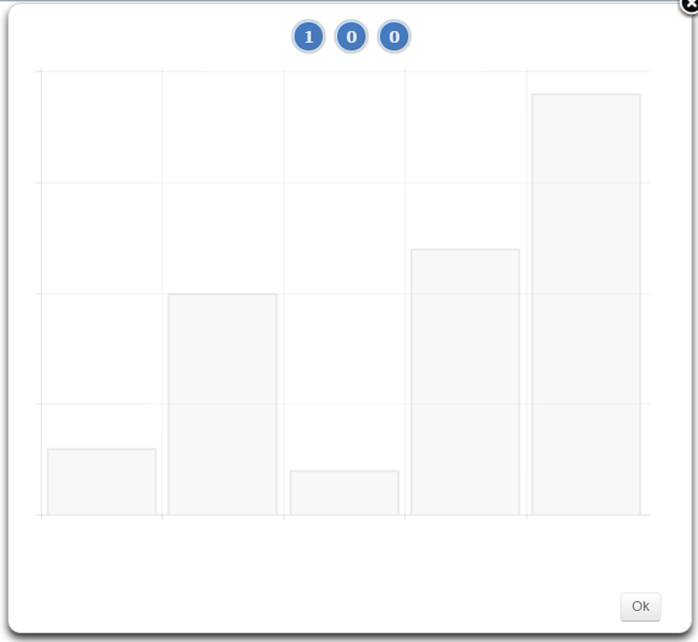
To select the number of reports shown per row, press the numbers. Maximum number is 3 reports per. row and 3 columns
Once you have chosen the number of reports you want to display in your dashboard, select "OK" at the bottom right.
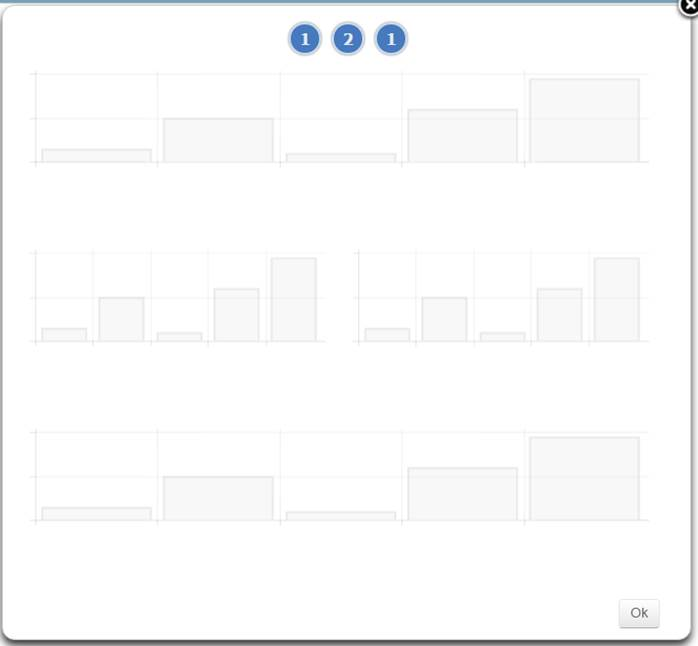
The report will then appear as shadows throughout your screen with the number of reports to be selected per row. Click directly on the first row that shows an indicator for the report.
Here you can choose a report type / graph from list below.
For example, select «The status of the week». The selected report is highlighted. Click the icon «Next».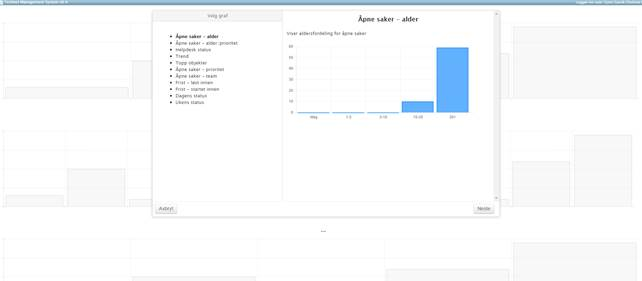
The report is displayed. Click on the next report you want to insert, for example select "Trend"
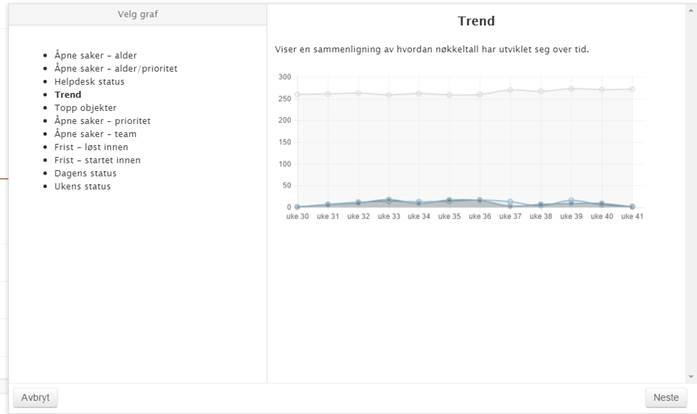
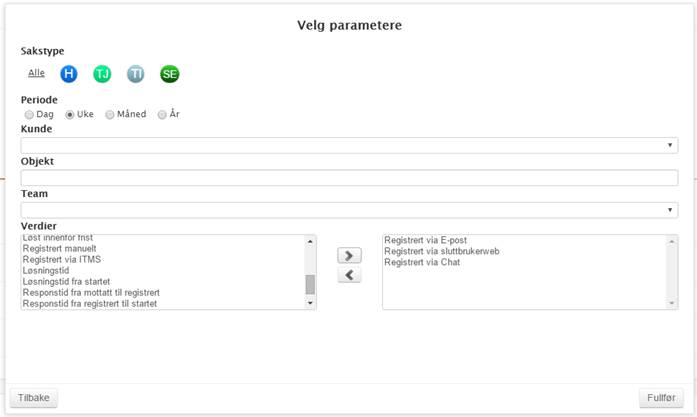
Click "Next". The following parameter selection appears, as shown in the view below.
Default choices are «All» types of cases, but you can also choose only I-Incident, -S-Service, etc.
Period: Day, week, month, or year.
Customer: Opportunities to follow up a specific customer group.
Item: Opportunities to follow up for example an application for a certain customer group, or all if you choose no one,
Team: Opportunities to choose a team or all
Values can be selected by marking the desired values in the left field,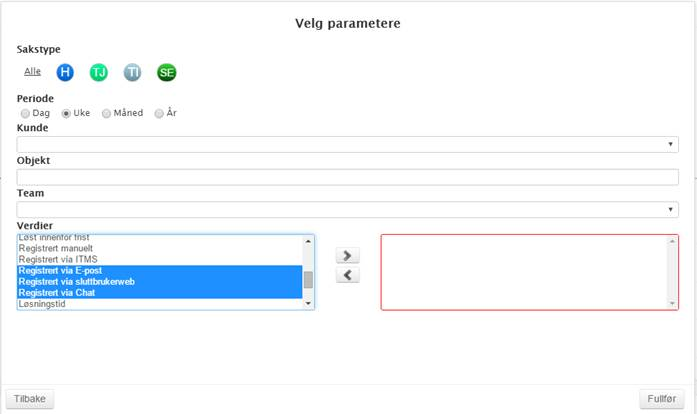
Use the arrow key > so that they are moved to the right field, as shown below. Then click "complete" at the bottom right of the view.
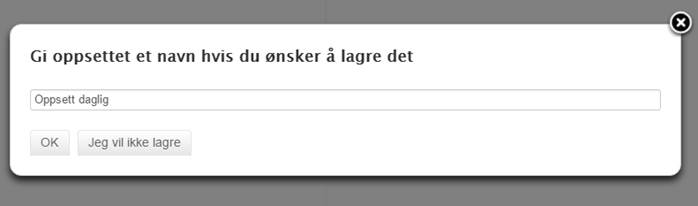
Continue to select dashboard reports, and set the up, until the dashboard is filled as you planned. When done, the following dialog box appears.
Give the dashboard a name and choose "Save"
...